📈 Analytics & AI • 🧮 Data Engineering • 🎓 Training
Turning raw data into revenue-ready decisions
We help teams move from scattered spreadsheets to scalable data products—so every decision is faster, clearer, and measurably impactful.
40%
Faster time-to-insight
3×
Dashboard adoption
$1.2M
Annualized ROI unlocked
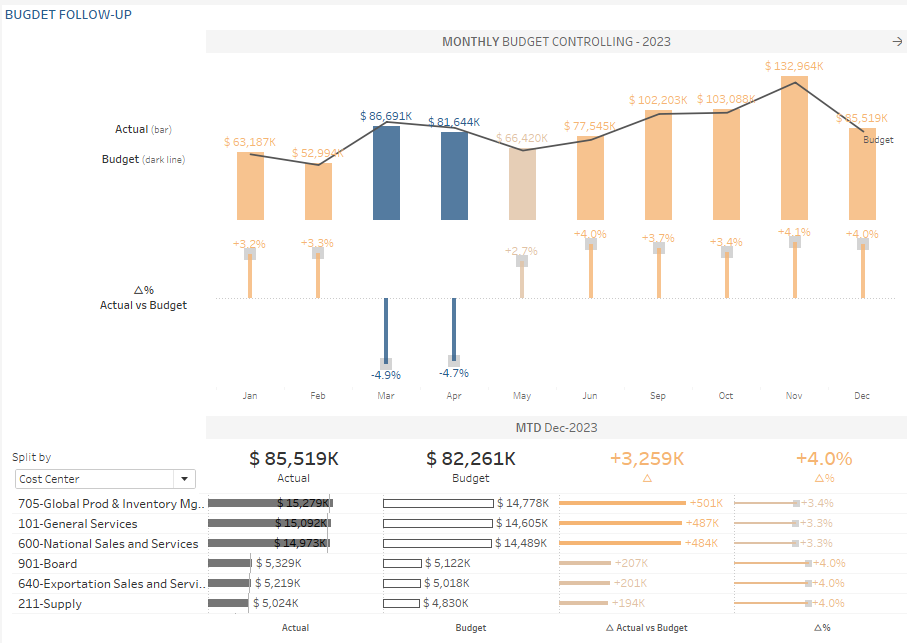
📊 Executive KPI Snapshot
What we do
Core offerings mapped to your goals: insight analysis, database & data structure development, and hands-on training for Tableau & Power BI.
Insight Analysis
KPI frameworks, cohort & funnel analysis, forecasting, churn & retention analytics, experimentation design, and executive dashboards.
Database & Data Structures
Data modeling (star/snowflake), ELT pipelines, warehousing (Snowflake/BigQuery/Redshift), dbt, orchestration, and governance.
Training
Role-based curricula for analysts and business users. Tableau & Power BI training, best-practice design systems, and COE playbooks.
AI Migration & Enablement
Helping businesses transition to AI-driven workflows: from strategy and model selection to implementation, integration, and staff enablement for sustainable adoption.
Sample Work
Interactive demos
Our approach
A proven, three-step path from question to durable capability.
Step 1
Discover
We clarify objectives, stakeholders, and constraints. We audit your data sources and map success metrics aligned to revenue or cost KPIs.
Step 2
Design
We model data, prototype dashboards, and select the right stack (Tableau, Power BI, dbt, Snowflake, etc.).
Step 3
Deliver
We productionize pipelines, deploy analytics apps, and train your teams so insights keep flowing long after go-live.
Engagement models
- Strategy sprint (2–4 weeks): roadmap, architecture, and quick-win dashboards
- Build-Operate-Transfer (8–16 weeks): we build, you scale
- Analytics COE enablement: standards, templates, peer review
- Flexible retainer: ongoing enhancements & ad-hoc analysis
Training & Enablement
Hands-on, role-based curricula that turn tools into adoption. Content adapts to your data and your team’s workflow.
Tableau
- Data connections & extracts
- Calculated fields & LODs
- Dashboard design (UX heuristics)
- Row-level security & permissions
- Publishing to Tableau Server/Public
Power BI
- Power Query & data shaping
- Modeling with DAX (star schema)
- Report interactions & bookmarks
- RLS & deployment pipelines
- Power BI Service & Apps
Excel
- Power Pivot & Power Query
- What-if, scenarios, & Solver
- Dynamic arrays & XLOOKUP
- Pivot tables & charts
- Automation with Office Scripts
Let’s talk
Tell us about your goals and data stack. We’ll reply with a short plan and options by the next business day.
What you get from a discovery call
- Clear problem framing & success metrics
- Architecture & tooling recommendations
- Scope, timeline, and pricing options
- Risk & dependency assessment